We are putting ourselves on the map!
Starting with borough boundaries and local forums & networks, we’ll be adding more items of interest – let us know what you’d like to see here.
Click on the stars to find networks and contact details. The drop-down list (top left on the map) has a list of boroughs.
Census 2011
(SkateTier – creative commons licence)
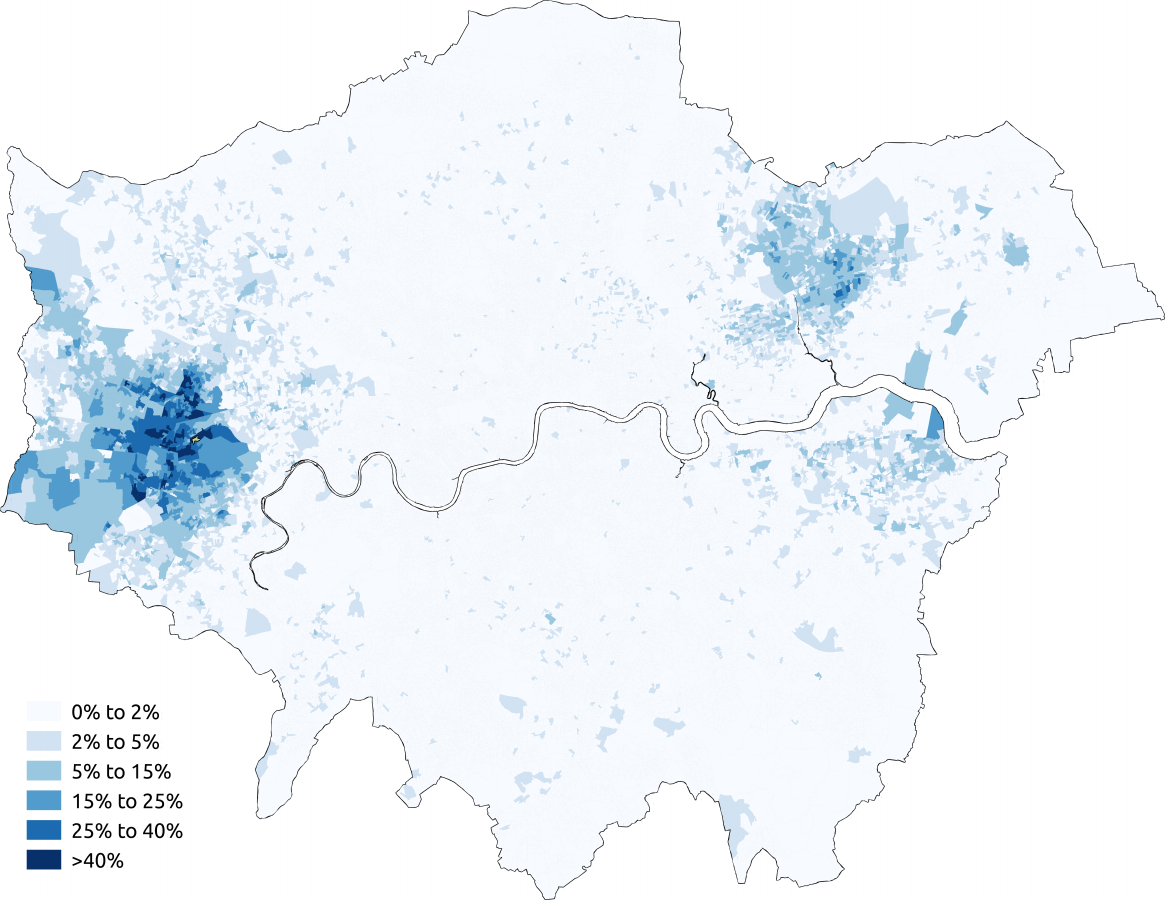
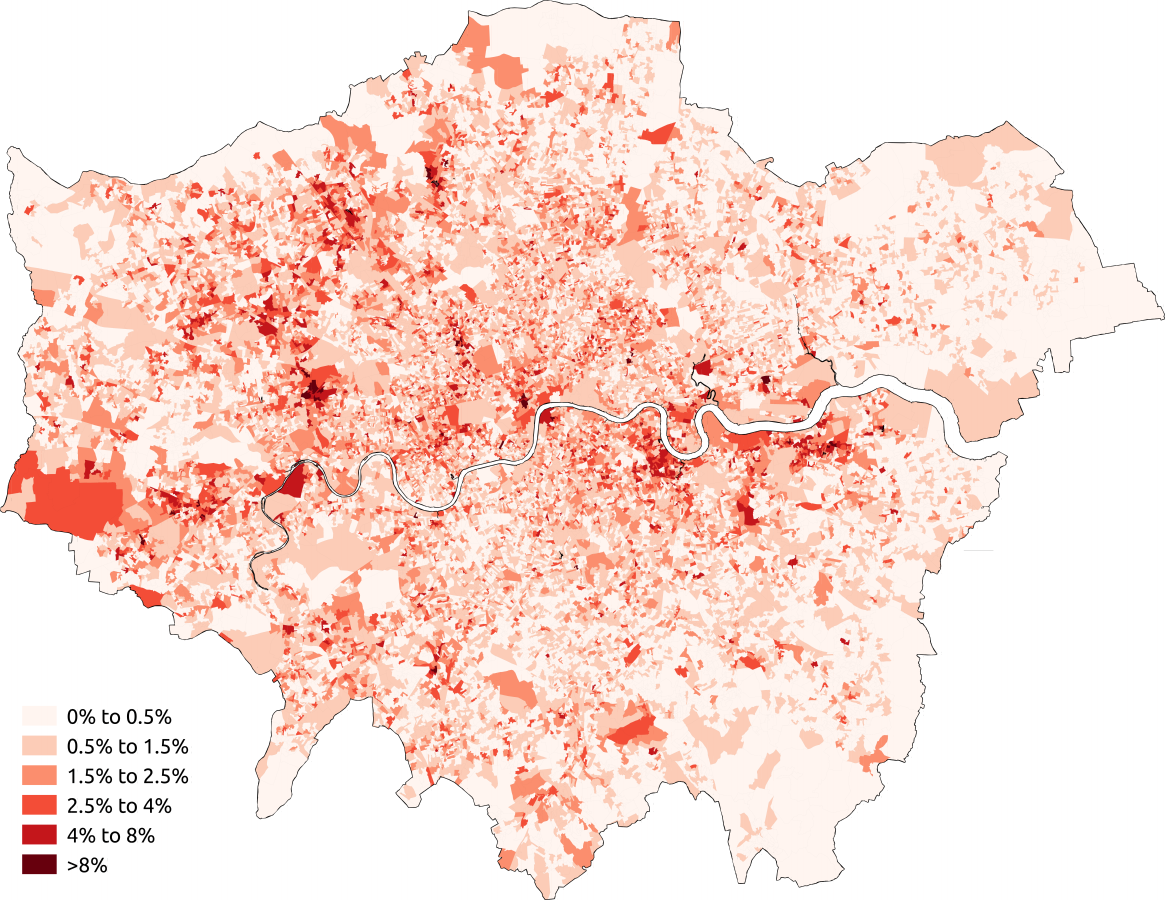
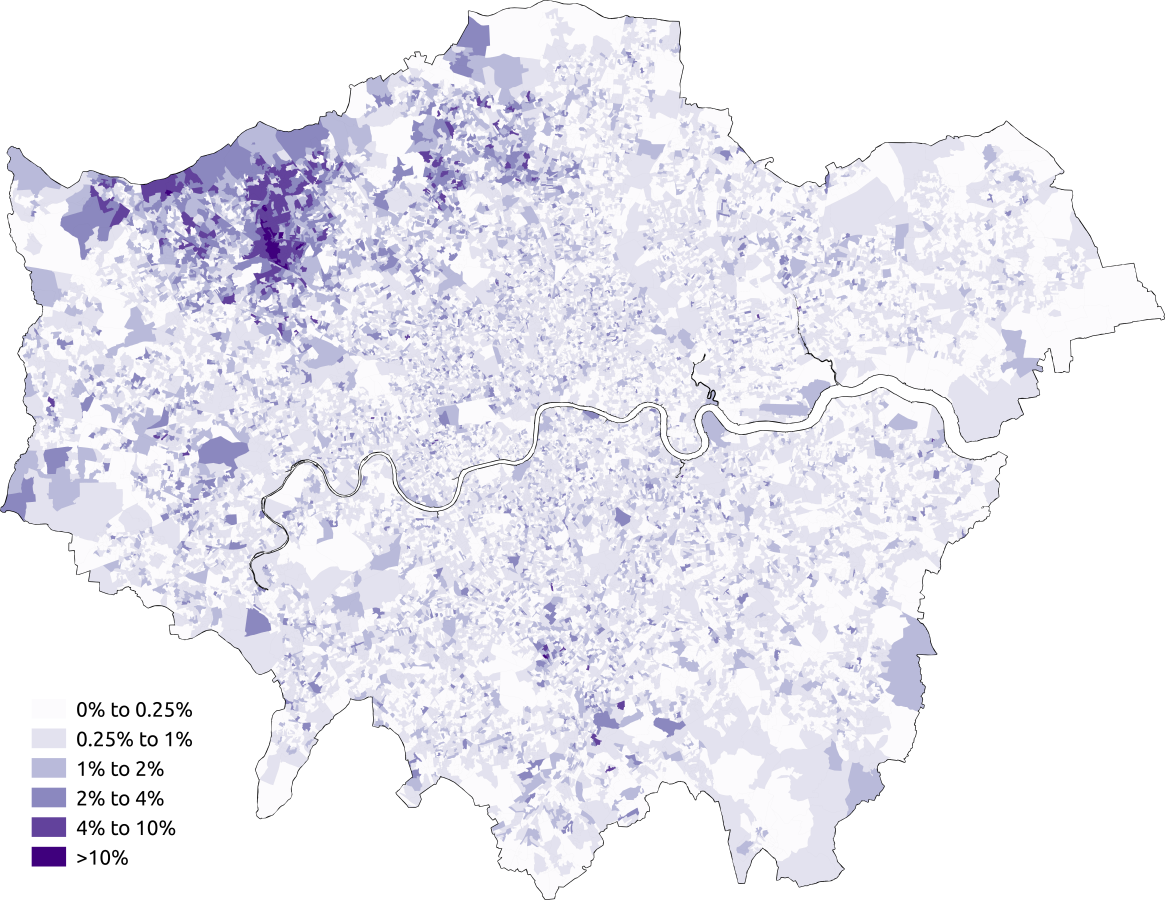
The maps below show the population density of London according to stated religion & belief in the last census – the darker the colour, the higher the proportion.
The shading is designed to show the differences in density of each category, so check the legends to see the percentages the shading represents.
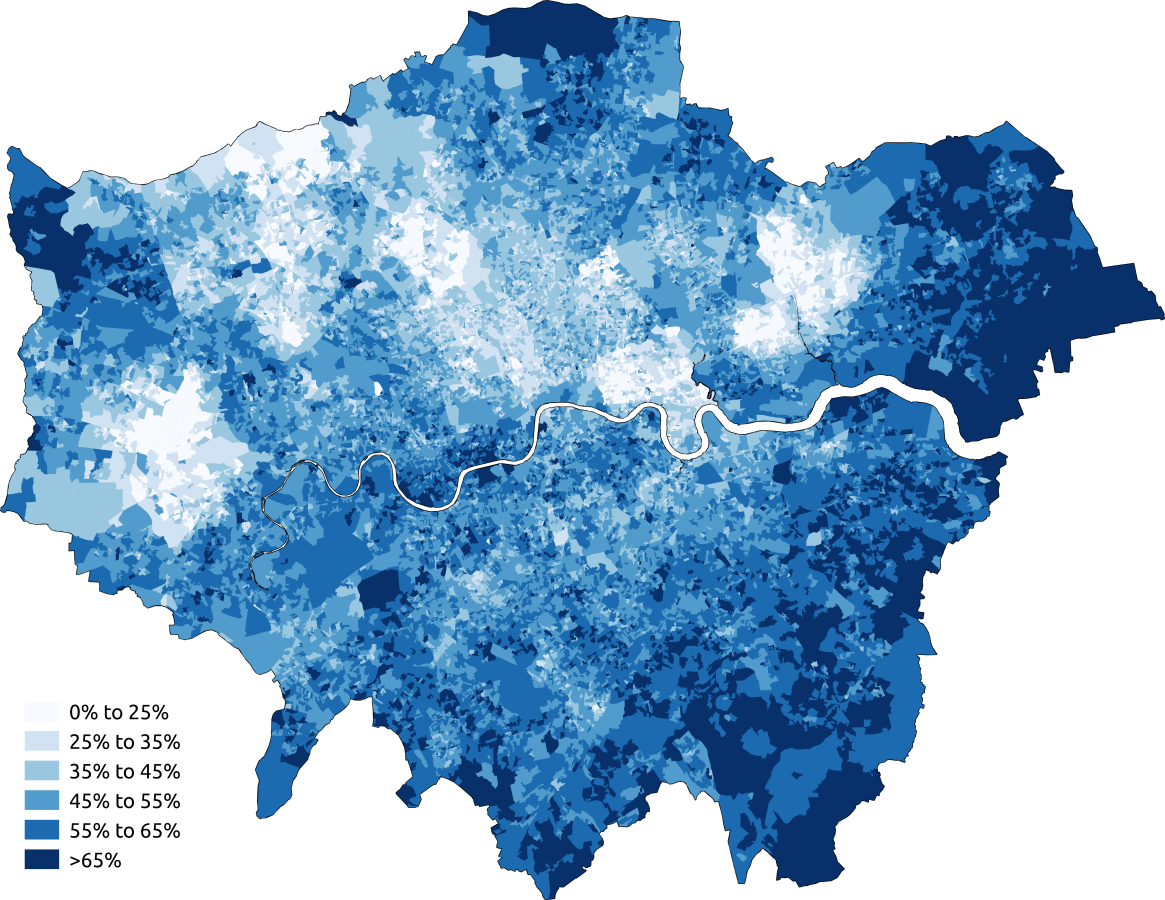
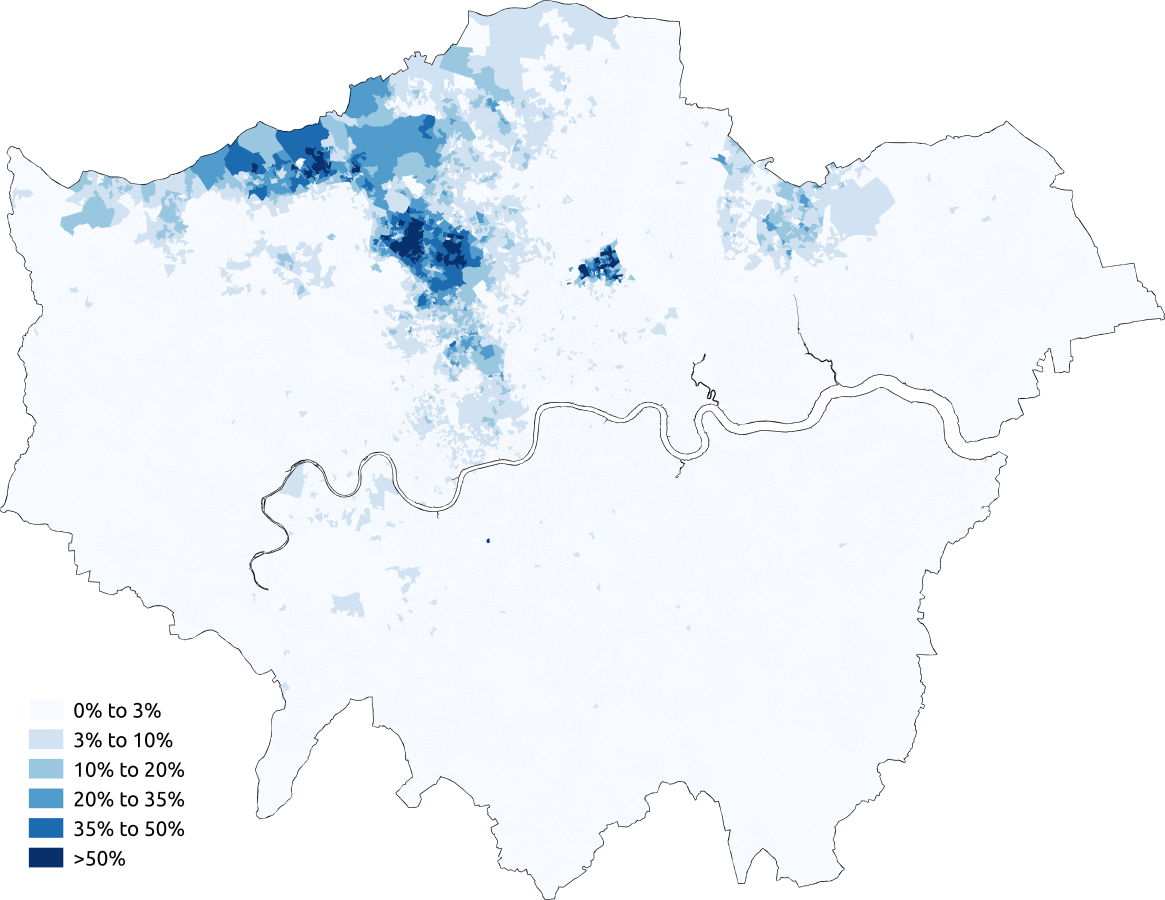
The 2011 Census asked people’s religion or belief. It was not a compulsory question and not all Londoners answered it.
Christianity 48.4%
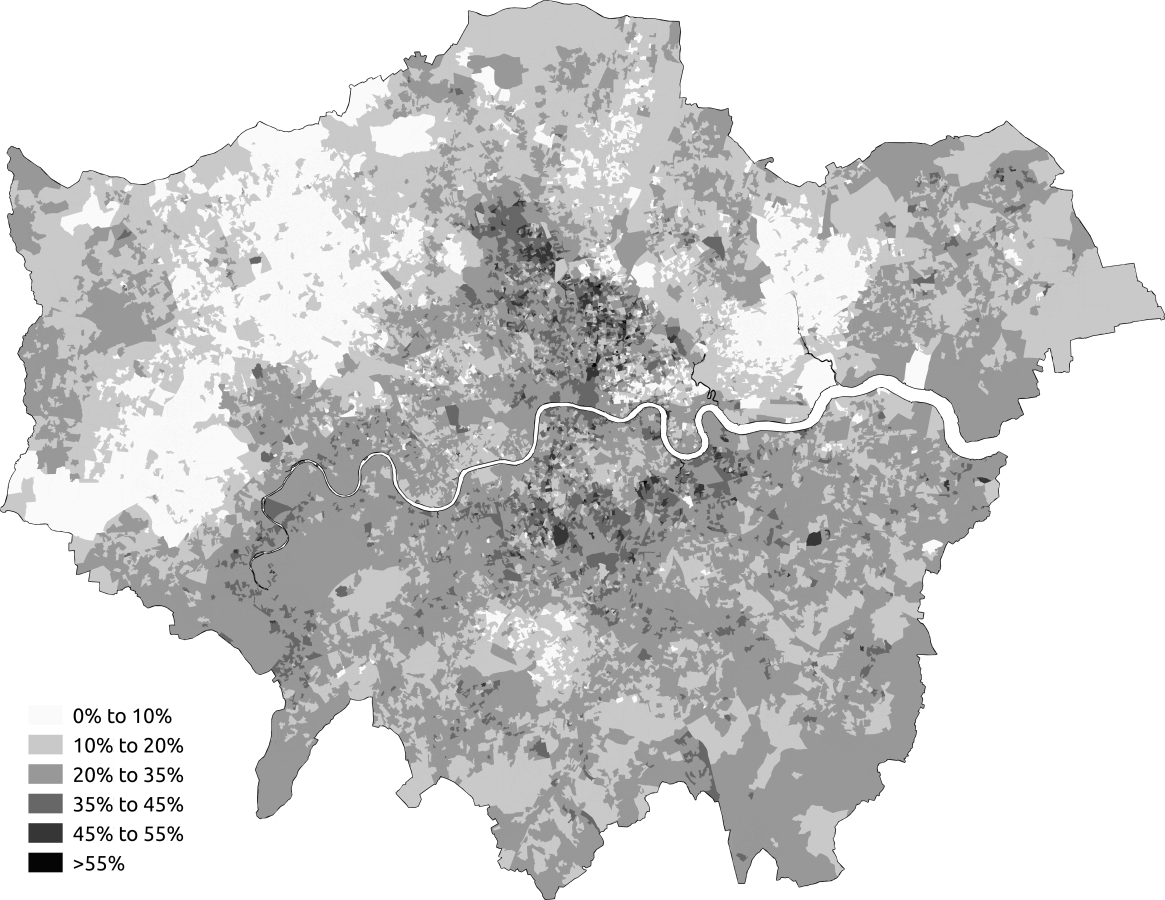
No religion 20.7%
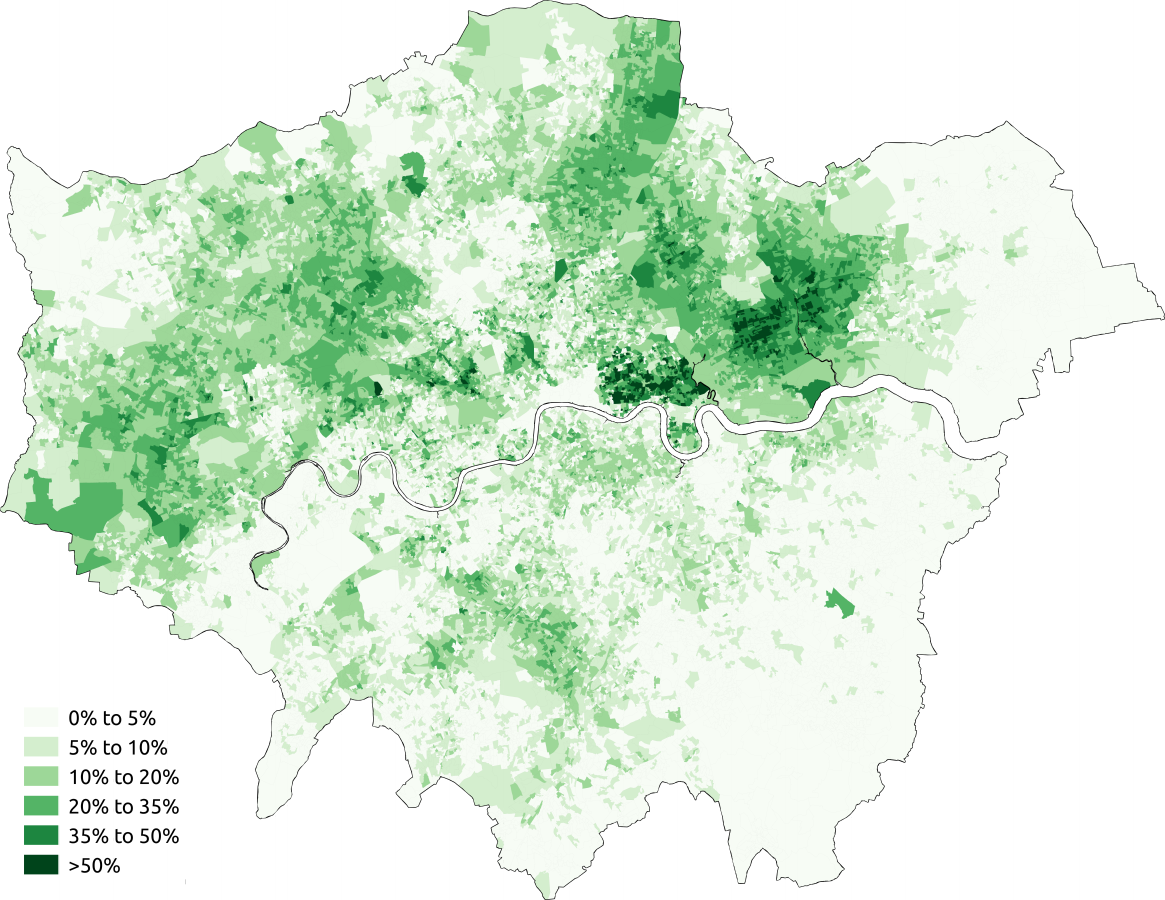
Islam 12.4%
Question unanswered 8.6%
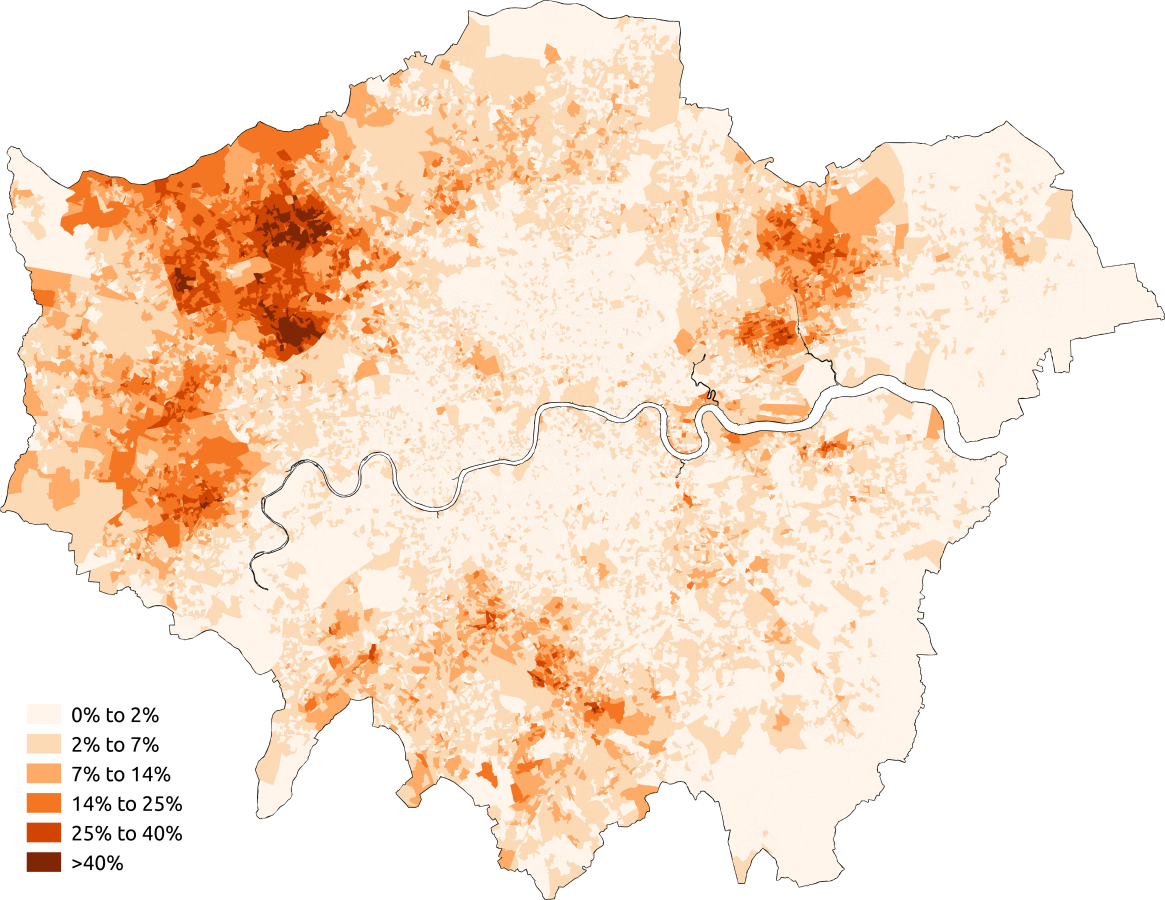
Hinduism 5.0%
Judaism 1.8%
Sikhism 1.5%
Buddhism 1.0%
Other religions 0.6%
